ICT and SMC Trading Course: A Complete Guide to the A–Z Guide Playlist
A–Z Guide Playlist Review: Learn ICT and SMC Step by Step
Part of “ICT & SMC A-Z Guide”
Learning ICT and SMC trading concepts may seem straightforward at first. You learn a few terms such as order blocks, liquidity, Fair Value Gaps, and market structure shifts, and then try to apply them to a chart.
In practice, however, traders are often confronted with several possible zones, conflicting signals, and multiple interpretations of the same price movement.
The main problem is not a lack of educational content. There are already thousands of videos about ICT and Smart Money Concepts. The real challenge is that most of these lessons are scattered and rarely explain how the different concepts should be combined into a complete trading framework.
The A–Z Guide playlist was created to provide a more structured learning path. It begins with important price zones and gradually moves into liquidity, market structure, price imbalances, trading sessions, timing, and entry models.
In this article, we will look at what the A–Z Guide teaches, who it is suitable for, and how traders can use it to study ICT and SMC concepts more effectively.
What Are ICT and SMC?
Before reviewing the playlist, it is helpful to understand what ICT and SMC generally refer to.
ICT stands for Inner Circle Trader. It refers to a trading methodology built around concepts such as liquidity, market structure, price delivery, institutional order flow, and time-based market behavior.
SMC stands for Smart Money Concepts. It is a broader term used to describe trading approaches that attempt to interpret how large market participants interact with liquidity and price.
Instead of relying only on traditional support and resistance levels or indicators, ICT and SMC traders usually ask questions such as:
Where is liquidity located?
Which side of the market is price likely to target?
Which price zone is most likely to produce a reaction?
Is the market structure bullish, bearish, or neutral?
At what time is a setup more likely to form?
Where should the trade target be placed?
The A–Z Guide playlist attempts to answer these questions in a logical sequence.
What Is the A–Z Guide Playlist?
The A–Z Guide is an educational series focused on ICT, SMC, and price-action-based market analysis.
The videos are organized so that viewers first become familiar with the individual components of an analysis and later learn how those components can work together.
The playlist covers topics such as:
Order blocks
Liquidity pools
Fair Value Gaps
Price imbalances
PD Arrays
Market structure
SMT divergence
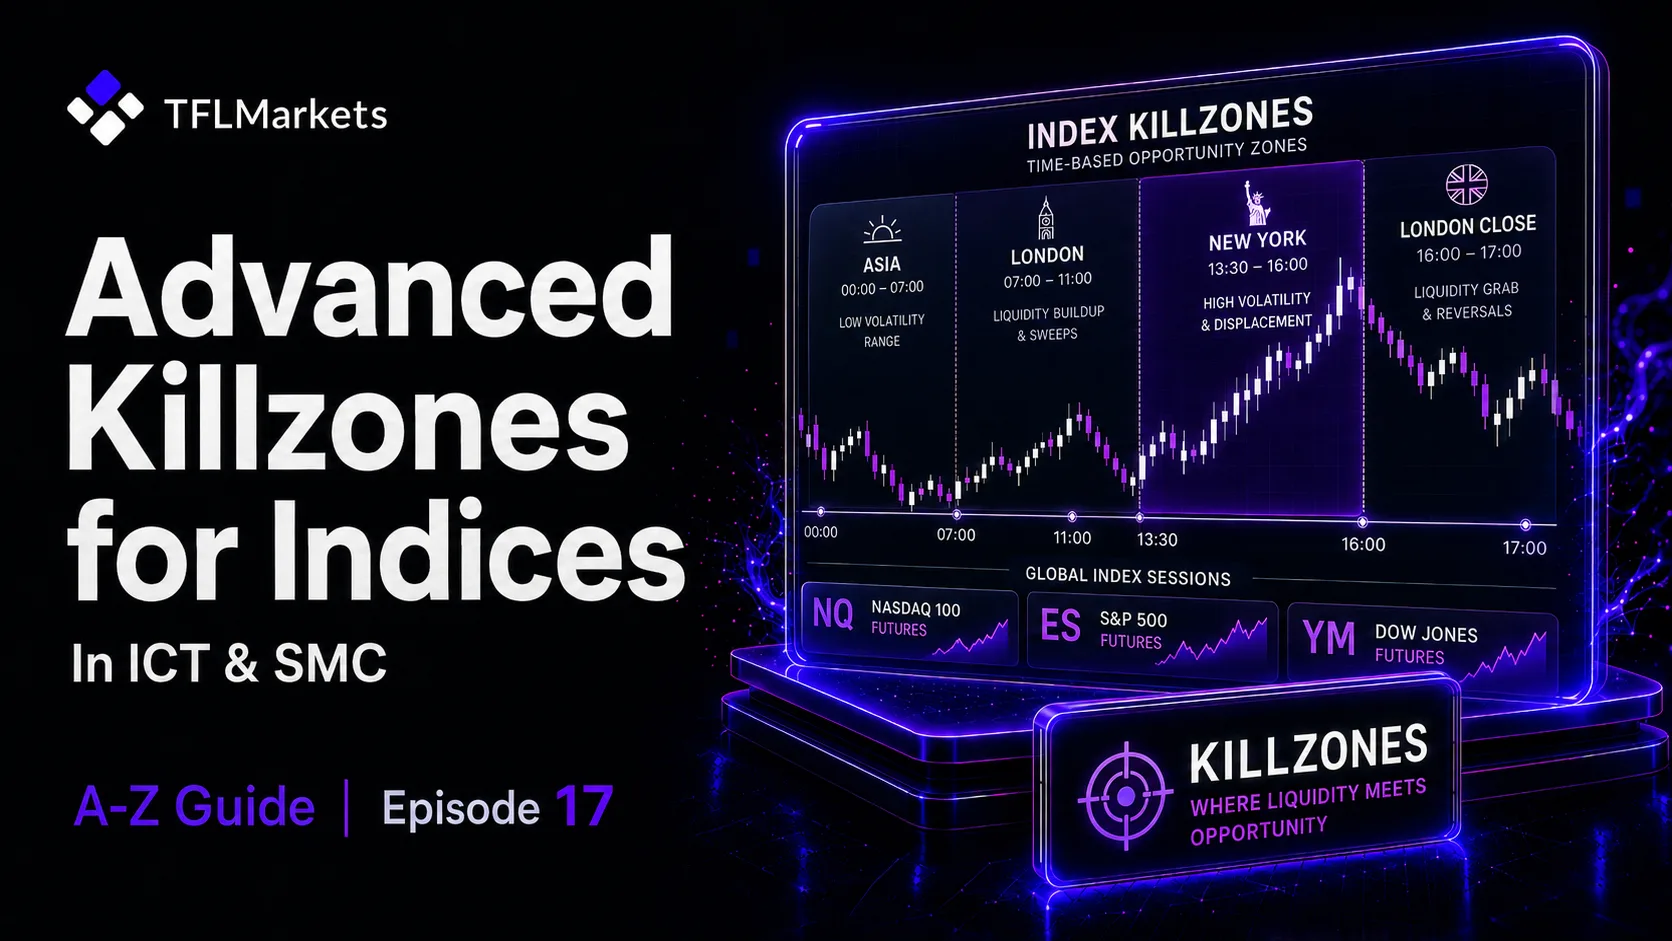
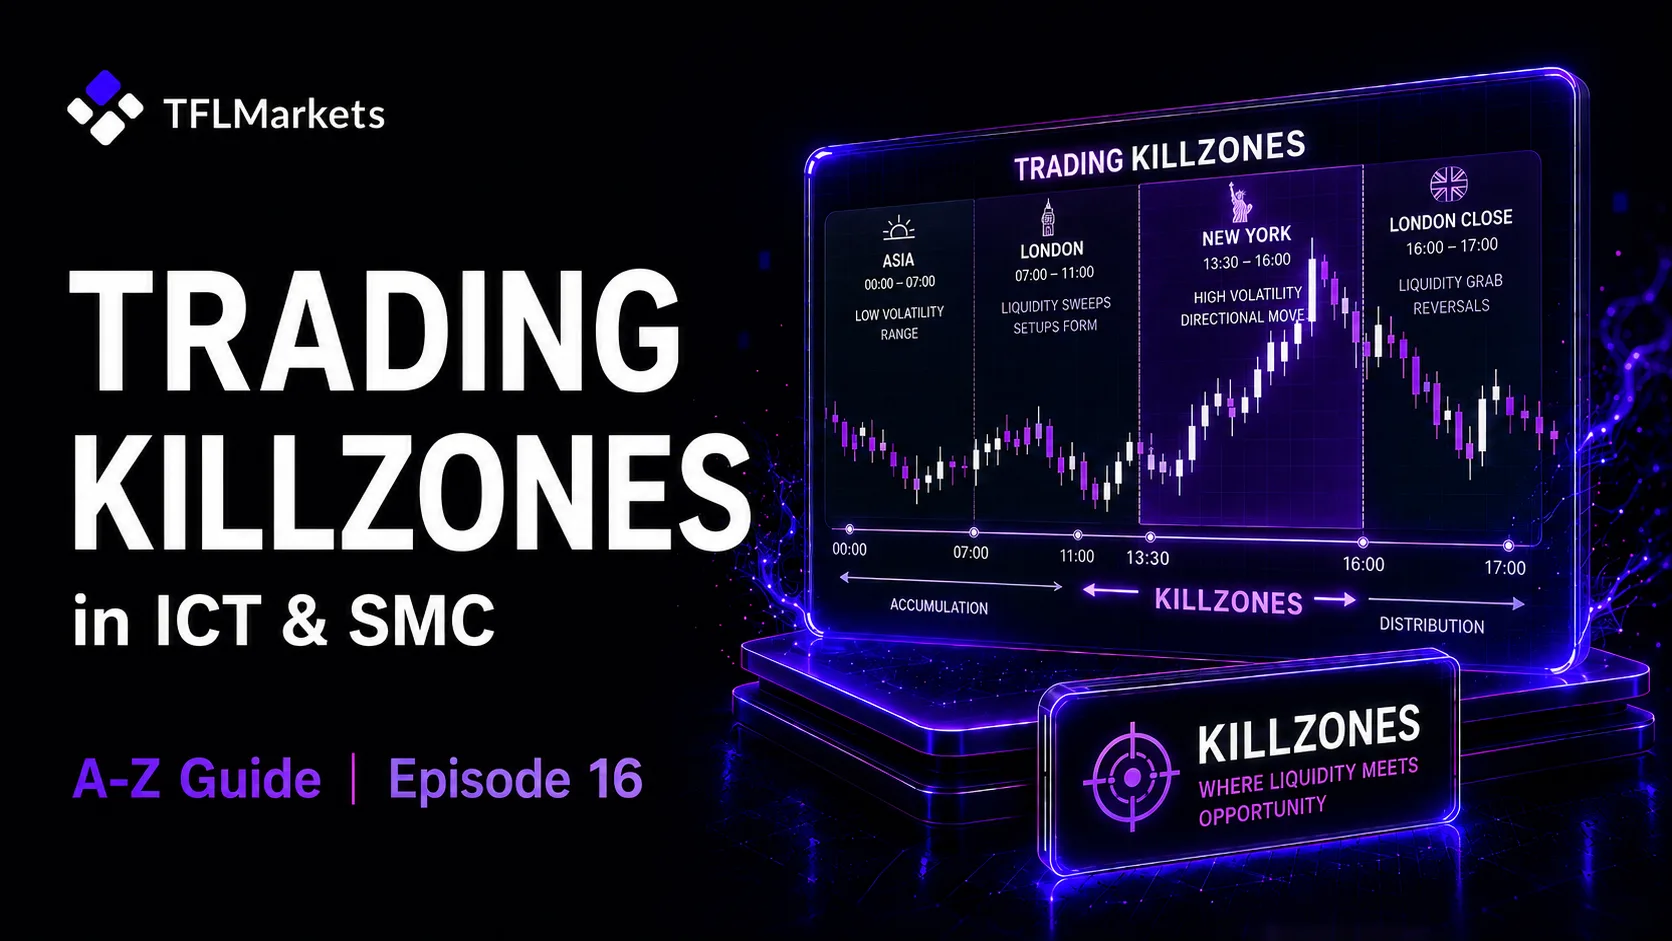
Kill zones
Power of Three
Judas Swing
Draw on Liquidity
Dealing ranges
Entry models
An important lesson throughout the series is that these concepts should not be used in isolation.
For example, the existence of a Fair Value Gap does not automatically create a valid trade. Its significance depends on market structure, liquidity, location, timing, and the broader directional bias.
Understanding Different Types of Price Blocks
One of the main sections of the A–Z Guide is dedicated to different types of price blocks.
In ICT and SMC trading, certain areas of the chart are considered important because they may represent previous institutional activity, unfilled orders, or zones where price could react again.
The playlist covers several types of blocks.
Order Block
An order block is one of the most widely discussed concepts in ICT and SMC.
It is commonly described as the final opposing candle before a strong directional move. However, not every opposing candle should be treated as a valid order block.
A stronger order block is normally supported by additional context, such as:
A meaningful break in market structure
A liquidity sweep
Strong displacement
A clear imbalance
Alignment with the higher-timeframe bias
The A–Z Guide helps traders move beyond simply drawing rectangles around random candles and instead focus on the logic behind the zone.
Mitigation Block
A mitigation block is a price zone that the market may revisit to mitigate or complete previously unfilled orders.
This concept can help explain why price sometimes returns precisely to a previous area before continuing in the original direction.
The validity of a mitigation block depends on the structure surrounding it and the events that caused it to form.
Breaker Block
A breaker block forms when a previously valid order block fails and is broken by price.
After being violated, the same area may later act as support or resistance in the opposite direction.
For example, a bullish order block that fails may later function as a bearish breaker when price returns to it.
Rejection Block
A rejection block is a zone where price has shown a sharp and immediate rejection.
These areas can be useful when identifying potential reversals or continuation points, especially when they align with liquidity and market structure.
Liquidity in ICT and SMC Trading
Liquidity is one of the most important ideas in the ICT methodology.
In financial markets, many stop-loss orders and breakout orders are placed around obvious highs, lows, and chart levels. These orders create pools of liquidity that price may move toward before making its next significant move.
The liquidity section of the playlist covers concepts such as:
Buy-side liquidity
Sell-side liquidity
Liquidity pools
Equal highs
Equal lows
Liquidity sweeps
Stop hunts
Buy-Side Liquidity
Buy-side liquidity is generally found above previous highs.
These areas may contain the stop-loss orders of short sellers as well as buy-stop orders from traders waiting for a bullish breakout.
When price moves above these highs, it may be collecting liquidity rather than beginning a genuine bullish continuation.
Sell-Side Liquidity
Sell-side liquidity is usually located below previous lows.
These areas may contain the stop-loss orders of buyers and sell-stop orders from traders attempting to trade a bearish breakout.
Understanding the location of liquidity can help traders avoid treating every breakout as a genuine trend continuation.
In many cases, price briefly moves beyond a high or low, collects orders, and then reverses in the opposite direction.
Fair Value Gaps and Price Imbalances
Another major section of the A–Z Guide focuses on Fair Value Gaps and other forms of price imbalance.
A Fair Value Gap, commonly abbreviated as FVG, is created when price moves with enough speed and displacement that an imbalance remains between buyers and sellers.
On a three-candle formation, this imbalance is often visible between the wick of the first candle and the wick of the third candle.
Price may later return to partially or fully rebalance this area.
The playlist also discusses related concepts, including:
Bullish Fair Value Gaps
Bearish Fair Value Gaps
BISI
SIBI
Balanced Price Range
Liquidity Void
Volume Imbalance
Is Every FVG a Trading Opportunity?
No. One of the most common mistakes made by new ICT traders is treating every visible Fair Value Gap as an entry signal.
An FVG should be assessed in relation to:
Overall market structure
Higher-timeframe directional bias
Liquidity that has already been taken
The location of the FVG
The relevant trading session
Premium and discount zones
Lower-timeframe confirmation
A Fair Value Gap is therefore only one part of a larger analysis.
Understanding PD Arrays
A chart may contain several order blocks, Fair Value Gaps, breaker blocks, and liquidity zones at the same time.
The trader must decide which of these areas is most relevant.
The concept of a PD Array helps traders organize and prioritize important price-delivery zones.
PD Arrays can be analyzed in relation to premium and discount areas, helping traders identify where buying or selling opportunities may be more favorable.
The goal is to replace random zone selection with a more structured process.
Rather than choosing the nearest order block or FVG, traders learn to consider where the zone sits within the broader dealing range and whether it supports the expected direction of price.
Learning Market Structure
Market structure helps traders determine whether price is moving in a bullish, bearish, or neutral direction.
The market structure section of the A–Z Guide explains how to identify:
Higher highs
Higher lows
Lower highs
Lower lows
Impulsive moves
Corrective moves
Breaks of structure
Changes in market behavior
Important concepts include:
Break of Structure, or BOS
Change of Character, or CHoCH
Market Structure Shift, or MSS
BOS vs. CHoCH
A Break of Structure usually confirms continuation in the direction of the existing structure.
A Change of Character may be an early sign that market behavior is changing and that the previous trend is weakening.
However, not every minor high or low should be used to identify BOS or CHoCH.
Traders must first determine which swing points are structurally meaningful and then assess the break in relation to displacement, liquidity, and the higher-timeframe narrative.
Internal Structure vs. External Structure
A major difficulty for new traders is distinguishing between internal market structure and the broader external structure.
A lower timeframe may appear bullish while the higher timeframe remains clearly bearish.
The bullish lower-timeframe move may simply be a correction within a larger bearish trend.
The playlist teaches viewers to analyze multiple timeframes and use lower-timeframe structure to refine entries rather than allowing it to override the broader market direction.
This helps traders avoid taking trades based only on small and insignificant structural shifts.
SMT Divergence
SMT divergence is another important confirmation tool covered in the A–Z Guide.
SMT stands for Smart Money Technique. It is commonly used by comparing the price behavior of two correlated markets or assets.
For example, one index may create a new high while another correlated index fails to do so.
This disagreement may indicate weakness in the move and suggest that the apparent breakout is not fully supported.
SMT divergence is generally more useful when combined with:
A liquidity sweep
A market structure shift
A higher-timeframe PD Array
Premium or discount positioning
Lower-timeframe confirmation
A clear Draw on Liquidity
SMT should not normally be treated as a standalone entry signal.
Kill Zones and Trading Sessions
Time plays a major role in ICT trading.
Not all hours of the trading day provide the same level of liquidity, volatility, or institutional activity.
Periods in which important market movements are more likely to develop are commonly referred to as kill zones.
The main trading sessions discussed in ICT analysis include:
Asian session
London session
New York session
London–New York overlap
The A–Z Guide examines how price behaves during different sessions and how traders can use time windows to improve setup selection.
A technically valid price zone may become more significant when price reaches it during an active session.
Similarly, a setup that appears outside the relevant session may provide weaker conditions or less predictable price action.
The Power of Three
The Power of Three is a well-known ICT model that divides price delivery into three stages:
Accumulation
Manipulation
Distribution
Accumulation
During accumulation, price often trades within a relatively narrow range.
Liquidity builds above and below the range while market participants take positions.
Manipulation
During manipulation, price may temporarily break one side of the range.
This move can trigger stop-loss orders and attract breakout traders before reversing.
Distribution
Distribution is the stage in which the main directional move develops.
Understanding the Power of Three can help traders distinguish between the initial deceptive move and the actual expansion phase.
What Is a Judas Swing?
A Judas Swing is a deceptive price movement that often occurs near the beginning of an active trading session.
Price initially moves in one direction, attracts traders, and collects liquidity before reversing and expanding in the opposite direction.
A Judas Swing should be evaluated in relation to:
The daily directional bias
Higher-timeframe liquidity
Session timing
Premium and discount
Lower-timeframe structure
The expected Draw on Liquidity
Without this context, traders may incorrectly label any early-session reversal as a Judas Swing.
What Is Draw on Liquidity?
Draw on Liquidity, often abbreviated as DOL, refers to the price objective that the market is likely to target.
Before entering a trade, the trader should have an idea of where price is expected to move.
A possible Draw on Liquidity may include:
A previous high
A previous low
Buy-side liquidity
Sell-side liquidity
A Fair Value Gap
An order block
A daily high or low
A session high or low
An external liquidity level
Identifying the Draw on Liquidity helps traders define logical profit targets before entering a position.
It also makes it easier to assess whether the potential reward justifies the risk.
Understanding the Dealing Range
A dealing range is the area between a meaningful high and low.
Traders use this range to determine the relative position of price and to identify premium and discount zones.
A dealing range is commonly divided into two main areas:
Premium
Discount
In a bullish scenario, traders may prefer to look for buying opportunities in the discount portion of the range.
In a bearish scenario, traders may prefer to look for selling opportunities in the premium portion.
This framework helps traders avoid making decisions based only on the appearance of a single order block or FVG.
The location of the zone within the overall range is equally important.
Who Is the A–Z Guide Playlist For?
The A–Z Guide can be useful for:
Beginners who are new to ICT
Traders studying Smart Money Concepts
Traders who struggle with market structure
People who understand individual concepts but cannot combine them
Traders looking for a more structured entry model
People who want to backtest ICT concepts
Traders attempting to reduce subjective decision-making
Traders who want to understand liquidity and price delivery
Basic knowledge of candlesticks, timeframes, order types, stop losses, and risk management is recommended before starting the playlist.
How to Study the A–Z Guide Effectively
Watching the videos alone is not enough to learn ICT or SMC properly.
Every concept must be studied and tested on real charts.
The following approach can make the learning process more effective.
1. Watch the Videos in Order
Start with the earlier episodes and avoid jumping directly to advanced models.
Later concepts often depend on ideas explained in previous videos.
2. Take Structured Notes
For each concept, write down:
Its definition
The conditions required for validity
The circumstances that invalidate it
Its role within a larger setup
3. Find Examples on the Chart
After watching each lesson, open a chart and search for several examples of the same concept.
Do not focus only on successful examples. Invalid setups are equally useful for learning.
4. Save Screenshots
Create a personal library of valid and invalid examples.
Mark the liquidity, structure, entry zone, target, and outcome directly on the screenshot.
5. Combine the Concepts
When analyzing an FVG, for example, ask:
What is the current market structure?
Which liquidity has already been taken?
Is the FVG in premium or discount?
Did displacement create the imbalance?
During which session did price return?
Is there lower-timeframe confirmation?
Where is the Draw on Liquidity?
This prevents traders from treating one concept as a complete strategy.
6. Backtest the Model
Before using a setup with real money, test it on historical data.
Record enough examples to determine whether the model performs consistently under specific market conditions.
7. Keep a Trading Journal
Document:
The reason for entry
Entry price
Stop-loss location
Profit target
Market session
Higher-timeframe bias
Liquidity event
Trade result
Execution mistakes
A journal helps reveal which parts of the trading model are effective and which need improvement.
Can the A–Z Guide Make a Trader Profitable?
No course or playlist can guarantee profitability.
The A–Z Guide may provide useful concepts and a structured framework, but long-term results depend on additional factors, including:
Consistent practice
Sufficient backtesting
Risk management
Position sizing
Emotional discipline
Following a defined trading plan
Reviewing losing trades
Focusing on one repeatable model
The objective should not be to search for a guaranteed signal.
A more realistic goal is to use the concepts to develop a clearly defined and testable trading framework.
Final Thoughts
The A–Z Guide is a structured educational playlist for learning ICT and Smart Money Concepts.
It begins with foundational topics such as order blocks, liquidity, and Fair Value Gaps, before moving into more advanced concepts such as market structure, SMT divergence, kill zones, the Power of Three, Judas Swing, Draw on Liquidity, and dealing ranges.
Its main value is that it encourages traders to understand the relationship between different concepts.
An order block, FVG, or market structure break is rarely enough on its own. Traders must also consider liquidity, context, timing, location, and the probable destination of price.
For the best results, watch the videos in order, practice every concept on a chart, document your observations, and backtest your trading model before using it in a live account.
Watch the A–Z Guide playlist on YouTube:
https://www.youtube.com/watch?v=2eTLwjFsMGo&list=PL5IcOO7sZoK04boclR5LzHbSgUAUCmSOY
Frequently Asked Questions About ICT and SMC
Is the A–Z Guide suitable for beginners?
Yes. The playlist introduces many of the core ICT and SMC concepts step by step.
However, viewers will benefit from having a basic understanding of candlesticks, timeframes, trade execution, stop losses, and risk management.
What is the difference between ICT and SMC?
ICT is a specific trading methodology built around liquidity, market structure, price delivery, and time.
SMC is a broader label used for trading methods that attempt to interpret institutional activity and liquidity.
Many SMC concepts are derived from, influenced by, or closely related to ICT teachings.
Is a Fair Value Gap enough to enter a trade?
No. A Fair Value Gap should be evaluated in relation to market structure, liquidity, higher-timeframe bias, premium and discount, session timing, and confirmation.
What is the best way to learn ICT?
A practical learning process should combine theoretical study, chart analysis, backtesting, screenshot collection, and journaling.
Watching videos without applying the concepts to charts is unlikely to produce consistent progress.
Can ICT concepts be used outside the forex market?
The concepts of liquidity, market structure, and price imbalance can be studied in several financial markets.
However, liquidity conditions, trading hours, spreads, volatility, and market behavior differ between forex, indices, commodities, cryptocurrencies, and stocks.
How long does it take to learn ICT?
Learning the terminology may not take long, but correctly identifying the concepts in real market conditions requires extensive practice.
The learning period depends on the trader’s experience, consistency, study process, and ability to backtest objectively.
Are indicators required for ICT trading?
No. ICT primarily focuses on price action, liquidity, market structure, and time.
Some traders use indicators as supporting tools, but indicators are not the main foundation of the methodology.
Should I use ICT concepts in a live account immediately?
It is generally better to begin with historical backtesting and then move to a demo account or a very small position size.
Live trading should only begin after the rules of the model are clearly defined and tested.