Market Filtering & Pair Selection: The Complete Guide to ICT and SMC – Part 14
In this episode, you’ll learn how market filtering and pair selection work in ICT and SMC, including how to compare correlated markets, use SMT divergence, and identify relative strength and weakness to choose the most suitable instrument for further analysis and trade setup confirmation.
Part of “ICT & SMC A-Z Guide”What Is Market Filtering in ICT and SMC?
Market filtering is the process of eliminating less suitable instruments before looking for an entry.
Its purpose is not to generate a new trading signal. Instead, it helps determine which market deserves the most attention among several related instruments.
Within ICT (Inner Circle Trader, a price-action framework focused on market structure, liquidity, and institutional behavior) and SMC (Smart Money Concepts, a methodology centered on institutional order flow and liquidity), several correlated markets may appear to have similar structures at the same time.
However, they do not always behave with the same degree of strength.
One instrument may sweep liquidity while another refuses to break the equivalent level. A third market may produce cleaner displacement and a more readable structure.
This is where Pair Selection becomes important.
Market filtering does not create a setup. It removes weaker choices before you start looking for an entry.
How Do You Choose the Best Trading Pair Through Market Filtering?
The core idea is to compare related markets rather than analyze each instrument completely independently.
A practical process looks like this:
Identify a group of related markets.
Determine the broader directional bias.
Compare how the instruments behave around corresponding levels.
Evaluate relative strength and weakness.
Look for divergence between correlated assets.
Select the market that best aligns with the scenario.
Only then wait for an entry model.
Each step serves a different purpose.
Step 1: Compare Related Markets Only
One of the foundations of this method is Intermarket Analysis, which means evaluating multiple related markets together.
To do this effectively, you need Correlated Assets: instruments whose price movements have a meaningful relationship.
For example, EUR/USD and GBP/USD can often be compared because both are major currency pairs involving the US dollar.
Likewise, major US equity indices are often compared with one another to identify relative strength or weakness.
The important point is that opening two random charts does not provide useful information.
The comparison only becomes meaningful when the markets have a logical relationship.
Positive and Negative Correlation
Correlation measures how closely two instruments tend to move in relation to one another.
It can be positive or negative.
Positive Correlation
With positive correlation, two markets generally tend to move in the same direction.
If one market creates a new high while the other fails to break its corresponding high, that lack of confirmation can become important.
The same principle applies to lows.
Negative Correlation
With negative correlation, two markets tend to move in opposite directions.
For example, when comparing a US dollar currency pair with the US Dollar Index, the relationship often needs to be interpreted inversely.
For beginners, comparing positively correlated markets is usually easier because corresponding highs and lows are more straightforward to evaluate.
Step 2: Establish the Market Scenario First
Filtering should never replace market analysis.
Before deciding which pair to trade, you need to know what type of scenario you are looking for.
If your bias is bullish, the question should not be:
“Which pair should I randomly buy?”
A better question is:
“Among the related markets, which one is showing greater relative strength and is therefore more suitable for a bullish scenario?”
The same logic applies to bearish conditions.
If the broader scenario is bearish, you want to identify the market showing more relative weakness.
Define the scenario first. Select the instrument second.
Step 3: Compare Relative Strength and Weakness
Relative Strength and Weakness refers to comparing two related markets to determine which one is behaving more strongly or more weakly.
Imagine two correlated currency pairs are declining.
One pair breaks below its previous low.
The other remains above its corresponding low.
The market that holds above its low is showing greater relative strength.
The opposite applies in bullish conditions.
If both instruments are rising but one fails to create a new high while the other continues higher, the lagging market is displaying relative weakness.
A simple rule is:
For bullish scenarios, focus on the stronger market.
For bearish scenarios, focus on the weaker market.
This does not mean entering immediately.
It simply tells you which chart deserves priority.
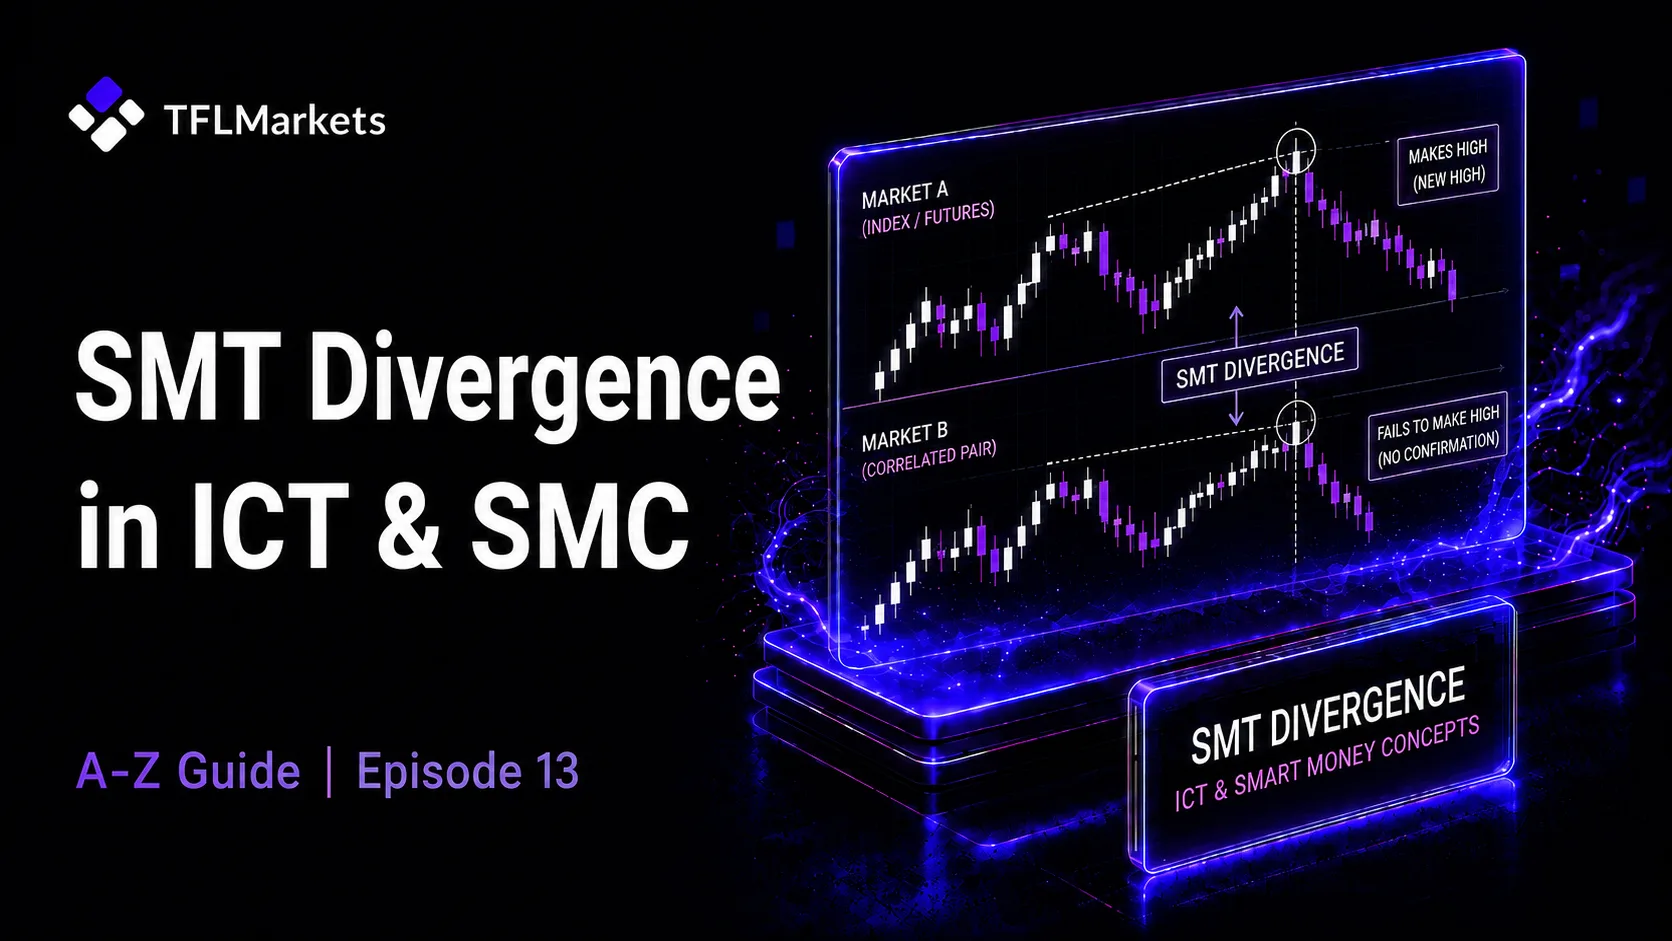
Step 4: Use SMT Divergence to Identify Lack of Confirmation
SMT Divergence (Smart Money Technique Divergence, a lack of confirmation between correlated markets) occurs when two related instruments stop behaving in the same way.
For example, suppose two positively correlated markets approach their previous lows.
Then:
Market A trades below its previous low.
Market B holds above its corresponding low.
Market B is demonstrating relative strength.
If your broader bias is bullish, Market B may become the more attractive market to monitor for a long setup.
The bearish version works in reverse.
Suppose:
Market A creates a new high.
Market B fails to break its corresponding high.
Market B is displaying relative weakness.
If your broader thesis is bearish, Market B may therefore become the better candidate for a short setup.
A Simple Pair Selection Example
Assume you are comparing EUR/USD and GBP/USD and your overall bias is bullish.
Both pairs trade into an area where you expect a reaction.
Then the following occurs:
Market | Price Behavior | Interpretation |
|---|---|---|
EUR/USD | Breaks below the previous low | Greater relative weakness |
GBP/USD | Holds above the previous low | Greater relative strength |
Result | GBP/USD shows stronger structure | Higher priority for bullish analysis |
The filtering process does not tell you to immediately buy GBP/USD.
Instead, it tells you:
If the bullish scenario is going to be traded, GBP/USD is currently the stronger candidate for further analysis.
You still need to wait for your actual entry model.
Step 5: Do Not Treat SMT as a Standalone Entry Signal
A common mistake is entering a trade immediately after noticing divergence between two related markets.
SMT is not, by itself, a complete entry model.
Its primary role is to help you understand:
which market is stronger;
which market is weaker;
which move is not being confirmed;
which chart deserves more attention.
In other words, SMT works well as a selection and confirmation tool, not as a standalone buy or sell signal.
Step 6: Evaluate the Quality of Price Action
Once you identify relative strength or weakness, you still need to assess whether the selected market provides a valid trading environment.
Ask:
Is the market structure clear?
Is the invalidation level identifiable?
Is price reacting in a readable way?
Has your entry model formed?
Is the selected market cleaner than the alternatives?
A market may be relatively stronger but still fail to produce a valid entry.
In that case, there is no requirement to trade.
Choosing the best market and finding an entry are two separate steps.
Market Filtering Process at a Glance
Step | Question | Expected Outcome |
1. Select related markets | Which instruments are worth comparing? | Comparison group |
2. Establish bias | Are you looking for bullish or bearish conditions? | Directional context |
3. Compare structure | Which market is holding highs or lows better? | Strength/weakness identified |
4. Check SMT | Are the markets confirming each other? | Divergence identified |
5. Select the instrument | Which market best matches the scenario? | Primary candidate |
6. Confirm entry model | Has the setup actually formed? | Trade or no trade |
Which Pair Should You Choose in a Bullish Scenario?
If your analysis is bullish, you generally want to focus on the correlated market showing greater relative strength.
For example, if one market trades below its previous low while another holds above its corresponding low, the second market is stronger in relative terms.
The basic logic is:
Bullish Bias → Focus on the stronger market
This still does not mean entering immediately.
After selecting the instrument, you must wait for your strategy's entry conditions.
Which Pair Should You Choose in a Bearish Scenario?
The logic reverses in bearish conditions.
If one correlated market makes a new high while the other fails to break its equivalent high, the second market is showing greater relative weakness.
The basic logic becomes:
Bearish Bias → Focus on the weaker market
This helps prevent random pair selection and gives you a clearer framework for deciding where to look for a setup.
Market Filtering vs. Entry Models
These two concepts should not be confused.
Market Filtering
Answers the question:
Which market should I analyze?
Entry Model
Answers the question:
When and under what conditions should I enter the selected market?
Filtering may tell you that GBP/USD is currently a better candidate than EUR/USD.
But until your entry model forms, there is still no trade.
Keeping these two stages separate can make the entire decision-making process much more structured.
Common Pair Selection Mistakes
Comparing Unrelated Markets
A divergence between unrelated instruments may have little analytical value.
The markets being compared need to have a meaningful relationship.
Entering Solely Because of SMT
SMT can provide context and confirmation, but it should not automatically trigger a trade.
Analyzing Too Many Charts
The purpose of filtering is to reduce the number of instruments you need to analyze deeply.
You do not need to take 20 charts all the way to the entry stage.
Eliminate weaker candidates early.
Selecting the Stronger Market in a Bearish Scenario
Relative strength and weakness must be interpreted in the context of your directional bias.
In simple terms:
Long scenario → stronger market
Short scenario → weaker market
Constantly Switching Pairs
Once filtering identifies the most suitable instrument, continuously jumping between charts can undermine the purpose of the process.
After selection, wait for the scenario to either develop or become invalid.
Market Filtering Checklist
Before looking for an entry, ask:
Are the markets I am comparing genuinely related?
Is my scenario bullish or bearish?
Which market is showing greater relative strength?
Which market is displaying greater relative weakness?
Is there SMT divergence at corresponding highs or lows?
Which instrument best matches my directional bias?
Is the selected chart structurally clear?
Has my entry model actually formed?
If the answer to the final question is no, there is still no trade.
Why Is Filtering Better Than Random Chart Scanning?
When traders constantly move between multiple markets without a clear filtering process, they are more likely to find something that merely looks like a setup.
Filtering changes the order of decision-making:
Eliminate → Select → Enter
Instead of searching for an entry first and then trying to justify it, you first identify the most suitable market and only then wait for a valid execution model.
That small change can make the overall analysis process much more disciplined.
Summary
Market filtering in ICT and SMC is a process for selecting the most suitable trading pair or instrument before searching for an entry.
The process involves:
comparing correlated markets;
establishing directional context first;
identifying relative strength and weakness;
using SMT divergence to detect lack of confirmation;
prioritizing the stronger market in bullish scenarios;
prioritizing the weaker market in bearish scenarios;
waiting for a valid entry model after the market has been selected.
The goal of filtering is not to find more trades. Its purpose is to eliminate more unsuitable ones before you trade.
No filtering process, correlation relationship, or SMT divergence can guarantee the outcome of a trade. These concepts should be used within a structured trading plan and appropriate risk-management framework.
Key Takeaways
Select the market before searching for an entry.
Compare only logically related instruments.
Treat SMT as a filtering and confirmation tool, not a standalone signal.
In bullish scenarios, relative strength is more important.
In bearish scenarios, relative weakness is more important.
A clean and readable chart is usually more useful than several ambiguous ones.
If filtering identifies a market but no entry model forms, the correct decision may still be to do nothing.
Frequently Asked Questions
Is SMT Divergence Enough to Select a Trading Pair?
No. SMT is a comparative tool used to identify relative strength, weakness, and lack of confirmation between correlated markets. Final pair selection should also consider the broader market context, price behavior, and the quality of the trading setup.
Which Market Should I Prioritize in a Bullish Scenario?
When comparing positively correlated markets, the instrument showing greater relative strength is generally the better candidate for bullish analysis.
For example, if one market makes a lower low while the other holds above its corresponding low, the second market is demonstrating greater relative strength.
Which Market Is Better in a Bearish Scenario?
The relatively weaker market is generally the better candidate for bearish analysis.
If one market fails to create a new high while its correlated counterpart does, that failure may indicate relative weakness.
Can Any Two Currency Pairs Be Compared for SMT?
No. SMT analysis should be applied to markets with a meaningful correlation or intermarket relationship.
Comparing unrelated instruments can produce misleading conclusions.
Should I Enter Immediately After Selecting the Best Pair?
No. Market filtering only identifies the instrument that deserves priority.
An entry should still depend on your trading model, invalidation criteria, market structure, and risk-management rules.